TTR Case Study
I finally got around to making a new blog post.
Firstly, I implemented zooming on the x axis and panning for the web based TTR visualization tool. Additionally, I added a slider to zoom on the y axis. The control is a bit clunky and unintuitive, but for my purposes, effective.
I have been spending a lot of time familiarizing myself with TTR curves and trying to figure out both how they could be useful and how to use the added information from a TTR curve to make it more useful that miss rate. I tried for a while to compare the curves with the ideal cache replacement strategy for a given cache configuration in hopes that the TTR would show where exactly a sub-optimal algorithm was being less effective. I did not have a lot of luck with this approach.
Eventually I decided to switch to using TTR to more quickly find an optimal cache configuration. The idea behind this is that if you were to run a program with a given cache configuration and replacement strategy, you would want to minimize the miss rate. However if you only have the miss rate, you have to blindly guess what cache configuration would improve the miss rate. This means that you essentially have to test all possibilities in the solution space, which can take a significant time to simulate. By using TTR as a guide, you can gain insight into what will improve your miss rate, which allows you to selectively examine cache configurations to get to the optimal solution. This could potentially save an engineer considerable time waiting for simulations to run.
Here's the procedure for interpreting TTR curves. First, we assume that we are holding the cache size constant. With this constraint, we have three parameters that can be varied, the number of sets, the line length, and the number of ways (associativity). I represent a cache configuration as (set bits)_(line bits)_(associativity ways). For example the configuration 5_6_4 would have 2^5 sets, 2^6 bytes per line and 4 associativity ways. Because the cache size is held constant, an increase in any one parameter must be accompanied by a decrease in another parameter. Thus, if we limit ourselves to varying as little as possible at a time, we have eight possible ways to modify a cache configuration:
| Modification |
|---|
| Increase associativity, decrease sets |
| Increase associativity, decrease line length |
| Increase sets, decrease line length |
| Increase sets, decrease associativity |
| Increase line length, decrease sets |
| Increase line length, decrease associativity |
From this, it is clear that without any insight into the direction that will lead to improvement, enumerating all possibilities would take exponential time! No need to fear, because TTR will allow us to apply heuristics to quickly converge on the optimal cache configuration. To demonstrate this in action, here's an example:
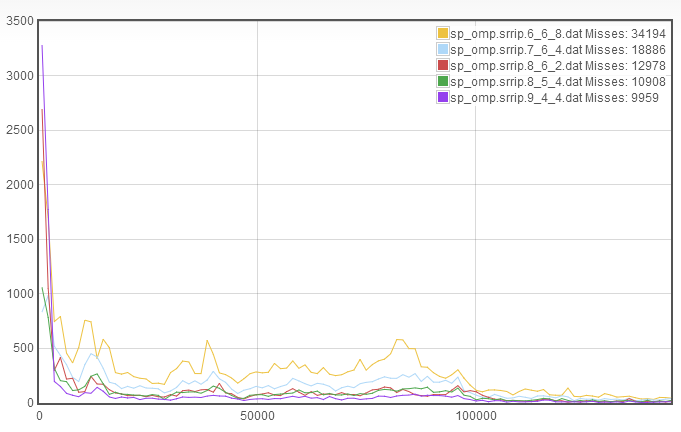
For this case, I decided to start with sp_omp. Among the traces that we have access to, it is a relatively cache intensive program, which makes it a good candidate to optimize. Additionally, I only consider a single cache replacement policy at a time. So for this example, I will find the optimal cache configuration using the Static Re- reference Interval Prediction (SRRIP) replacement scheme. To begin, we arbitrarily select the 6_6_8 cache configuration. The TTR curve for this is
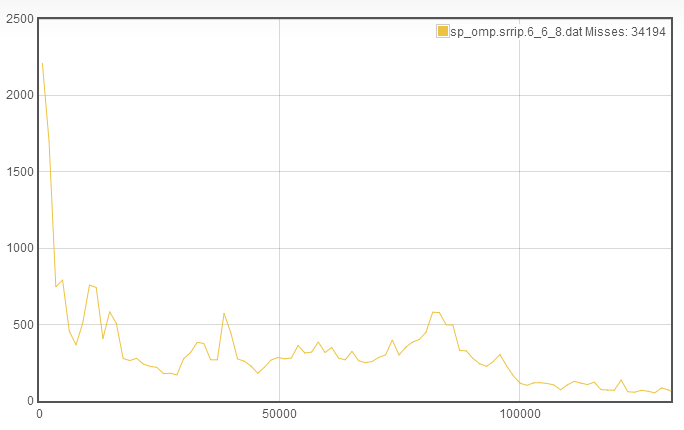
Allow me to explain this plot for the uninitiated, since it doesn't have any axis labels... The x axis is memory accesses to recache. Essentially, if a line is evicted from the cache and brought back in after a small number of memory access, it will end up close to the y axis. The y axis is the number of recache occurences of a particular durationthat occur in the course of sampling. Note that the data is also bucketed and was sampled with a warmup period to remove cumpolsory misses. Notice in the top that the series name is listed including the total misses, which we can use as a proxy for miss rate since the same number of cycles was run for each TTR curve we are comparing.
So, how do you interpret this graph? What I key in on is what I call the rapid recaching (RR), which I think can also be referred to as thrashing. In this case, we see that among the roughly 34000 misses, only about 2200 were due to rapid recaching. This means that we can afford to decrease associativity and increase either the number of sets or the line length. Without any additional information, I have no good way to determine whether line length or set number should be increased. I found that by choosing either, you will eventually converge on the same answer. So for the purposes of brevity, I will choose to increase the number of sets. This makes the new cache configuration 7_6_4:
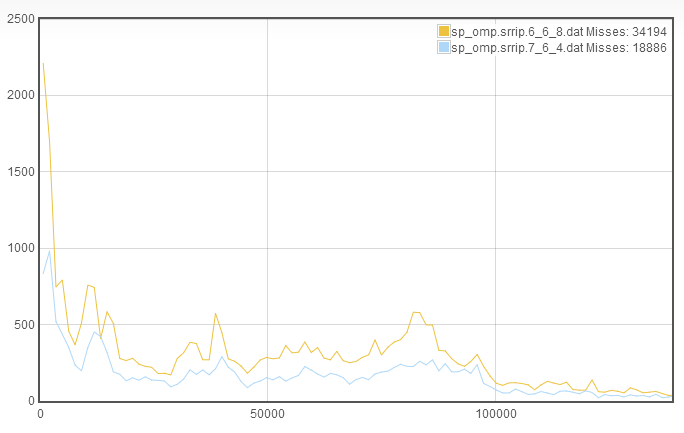
From this, we see that we have a signficant decrease in misses and the decrease comes roughly equally from all parts of the TTR curve. Additionally, despite decreasing associativity, the rapid recaching is still quite low. This suggests that we again decrease the associativity to increase the number of sets, this results in a cache configuration of 8_6_2:
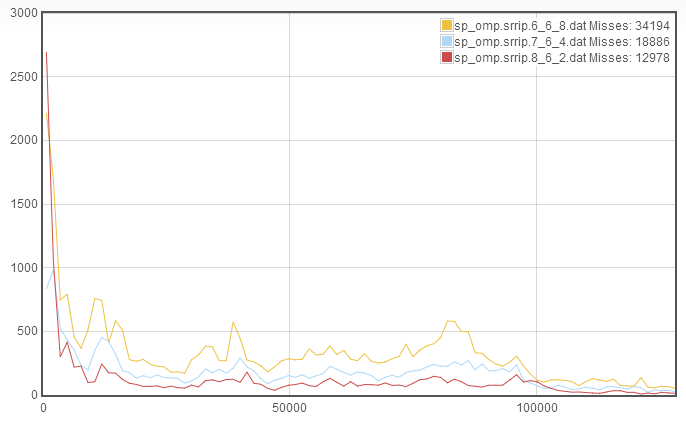
We see that again we see an improvement in the misses. However, now the rapid recaching has skyrocketed! This suggests that the increase in number of sets was beneficial, but the decrease in associativity was detrimental. Therefore, we try to increase associativity at the expense of line length, which gives the new cache configuration 8_5_4:
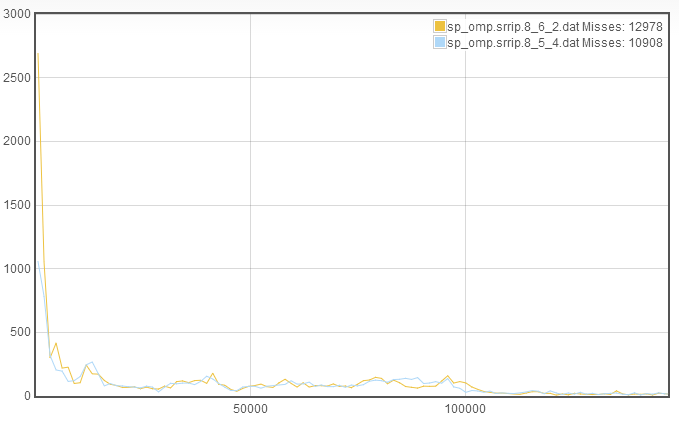
We again see improvement in the number of misses, however in this case, the improvement is due almost entirely to a decrease in the rapid recaching. This suggests that we may have room to further decrease the line length. Since the rapid recaching is not significantly larger than the slower recaching, this suggests that we use the decreased line length to increase the number of sets, to get a new cache configuration of 9_4_4.
We see very minor improvement in the misses, because the slower recache rates have gone down but the rapid recaching has skyrocketed. This suggests that we increase the associativity. I don't have any intuition for whether line length or number of sets should be decreased, so we can abritrarily choose to decrease the line length so that we now have 9_3_8.
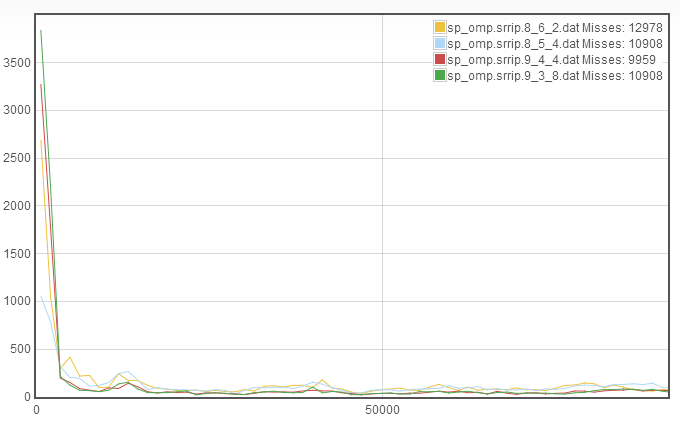
We see that the miss rate increased. This is due to an increase in the rapid recaching without significant improvement in the slower recaches. This leaves the only reasonable place for improvement to be to go back to the 9_4_4 configuration and decrease the number of sets instead of the line length, to get 8_4_8:
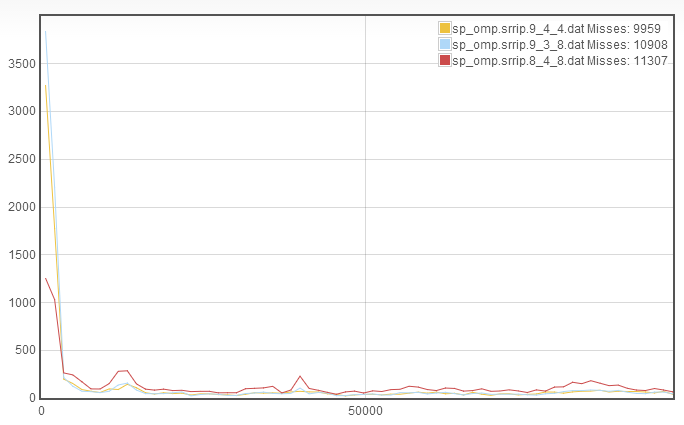
We see that again there is not an improvement in misses relative to 9_4_4. We find that the rapid recache went down considerably, however there's no way to increase the associativity that we haven't already tested! So we conclude that the optimal cache configuration is 9_4_4.
Having run nearly all of the reasonable cache configurations, this does in fact appear to be the optimal cache configuration.
I am running more cache configurations and when they finish, I'd like to repeat this process to determine whether it consistently finds the optimal cache configuration.